Monitoring
I was searching for a lightweight monitoring solution for my single freebsd home server.
It should be able to get storage, cpu and memory metrics, look at file changes, check up my services and send alerts.
I took a look at monitoring stacks like Prometheus-Node_exporter-Grafana or Telegraf-InfluxDB-Chronograf-Kapacitor. It looked like to me a rabbit hole, grafana dashboard is pretty, it does tons of things, but it can’t handle simplest of my needs. You still need AlertManager to send mails with your prometheus stack. Endless microservices chain…
Those are great solutions when managing large node/service farms.
Turnkey solution : Netdata
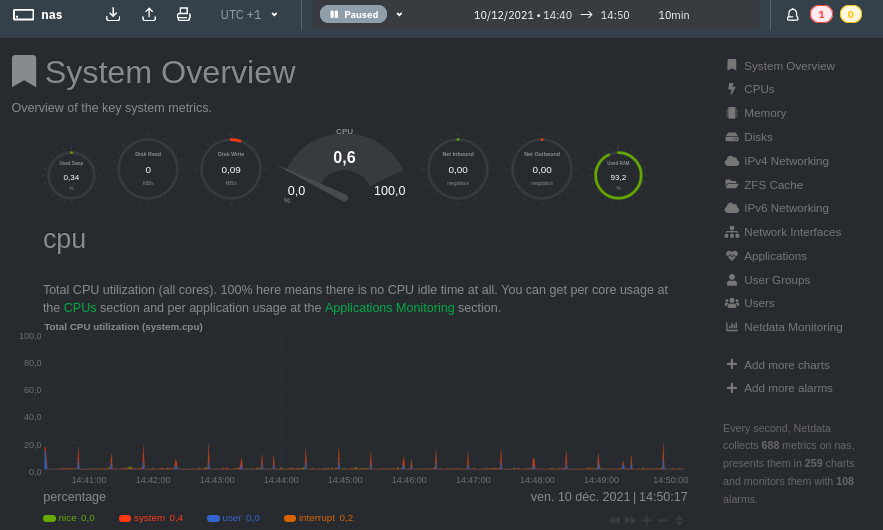
Netdata provides a nice dashboard with realtime metrics, and it supervises system health. It can raise a lot of alerts by default and mail it.
I had to configure DragonFly Mail Agent which is a small Mail Transfert Agent with SMTP authentication over TLS/SSL.
/etc/dma/dma.conf
SMARTHOST smtp.domain.com
PORT 587
AUTHPATH /etc/dma/auth.conf
SECURETRANSFER
STARTTLS
MAILNAME eoli3n.eu.org
/etc/dma/auth.conf
mail@domain.com|smtp.domain.com:P@ssw0rd!
Let’s configure mail forwarding from root to external email
/etc/aliases
root: jonathan.kirszling@runbox.com
I can now test netdata mail transfert by running a test script.
$ /usr/local/libexec/netdata/plugins.d/alarm-notify.sh test
Out of the box, netdata checks metrics every seconds, and stores it to RAM with 2 days of retention. With htop, I have noticed 1.7% of CPU and 0.7% of RAM.
Following recommendations for performance, netdata dropped to 0.0% of CPU, 0.4% of RAM, with 2 weeks of metrics retention.
/usr/local/etc/netdata/netdata.conf
 [global]
+    memory mode = dbengine
+    page cache size = 32
+    dbengine multihost disk space = 256
-    history = 86400
+    update every = 5
+    debug log = none
+    error log = none
+    access log = none

 [plugins]
     freebsd = yes

 [web]
     respect do not track policy = yes
     disconnect idle clients after seconds = 3600
     bind to = 127.0.0.1
     web files owner = netdata
     web files group = netdata
Netdata seems to be clever, it checks a lots of things, but I would like a more declarative solution, to check and alert anything I need.
Declarative and lightweight solution : Monit
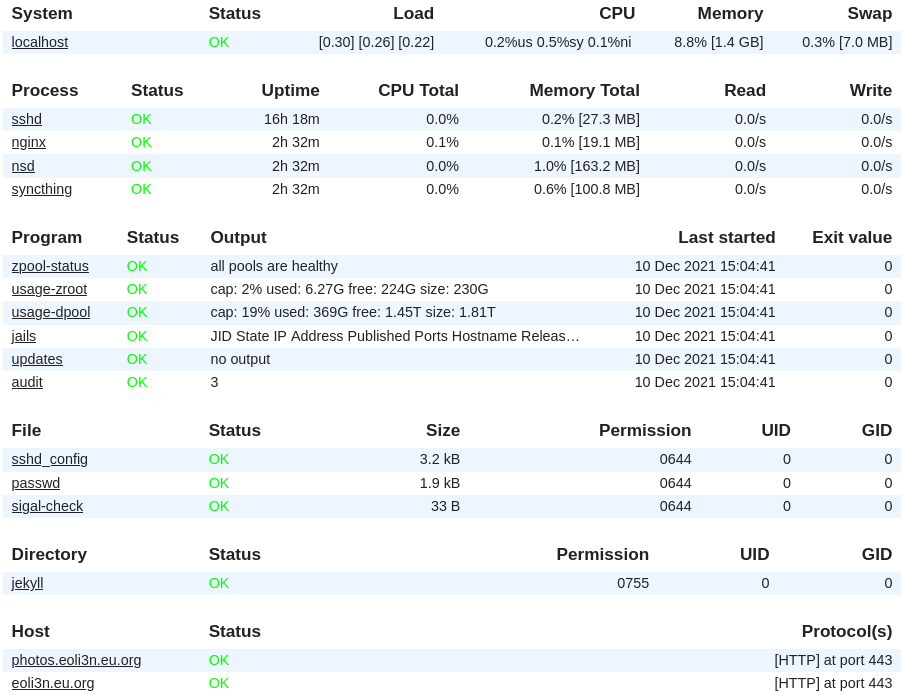
Monit is a small utility for managing and monitoring processes, files, directories, filesystems, programs, scripts, hosts, system metrics… It conducts automatic maintenance and repair if you ask it to. It also embeed a clean WebUI to keep an eye on all monitored services.
Simply install monit through your package manager and start writing your monitrc file.
Here the jinja template I wrote for my server, explained in comments. I don’t even need to over-comment it, because the DSL syntax is human readable.
set log /var/log/monit.log

# Check every 30 seconds and delay 120s at start
set daemon 30
    with start delay 120

# Enable WebUI and configure it
set httpd
    port 8080
    use address 127.0.0.1
    allow localhost
    signature disable

# Recipient email for alerts
set alert

# Configure SMTP server to use to send alert.
# Monit doesn't use system sendmail command.
set mailserver  port
    username "" password "" using ssl

set mail-format {
    from: Monit <monit@>
    reply-to: noreply@
    subject: $ACTION $SERVICE
    message:
Date:        $DATE
Service:     $SERVICE
Event:       $EVENT
Action:      $ACTION
Description: $DESCRIPTION.
}

# Zpool health
check program zpool-status with path "/sbin/zpool status -x"
    if status != 0 then alert

# Check zpool usage with a custom script
check program usage-zroot with path "/tmp/zpool_usage.sh zroot"
    if status != 0 then alert
check program usage-dpool with path "/tmp/zpool_usage.sh dpool"
    if status != 0 then alert
check program scrub-zroot with path "/tmp/zpool_scrub.sh zroot"
    if status != 0 then alert
check program scrub-dpool with path "/tmp/zpool_scrub.sh dpool"
    if status != 0 then alert

# Resources
check system localhost
    if memory usage > 85% for 3 cycles then alert
    if loadavg (15min) > 4 then alert
    if cpu usage > 85% for 3 cycles then alert
    if swap usage > 25% for 3 cycles then alert

# SSHD
check process sshd with pidfile /var/run/sshd.pid
    start program = "/usr/sbin/service sshd start"
    stop program = "/usr/sbin/service sshd stop"
    if failed port  protocol ssh then restart
    if changed pid then alert
check file sshd_config path /etc/ssh/sshd_config
    if changed md5 checksum then alert

check file passwd path /etc/passwd
    if changed md5 checksum then alert

# Jails
check program jails with path "/usr/local/bin/bastille list -a"
    if content == "Down" then alert

# Updates
check program updates with path "/usr/bin/awk '/packages to be upgraded/ {v+=$NF}END{print v;if (v>=5) exit 1}' /tmp/check-updates"
    if status == 1 then alert

# Audit
check program audit with path "/usr/bin/awk '/found/ {v+=$1}END{print v;if (v>=5) exit 1}' /tmp/bastille-audit"
    if status == 1 then alert

# Web
check process nginx with pidfile /usr/local/bastille/jails/nginx/root/var/run/nginx.pid
    start program = "/usr/local/bin/bastille start nginx"
    stop program  = "/usr/local/bin/bastille stop nginx"
    if failed host photos.eoli3n.eu.org port 443 protocol https content = "Photos" then alert
    if failed host eoli3n.eu.org port 443 protocol https content = "… Blog …" then alert

# DNS
check process nsd with pidfile /usr/local/bastille/jails/nsd/root/var/run/nsd/nsd.pid
    start program = "/usr/local/bin/bastille start nsd"
    stop program  = "/usr/local/bin/bastille stop nsd"
    if failed host  port 53 use type udp protocol dns then restart
    if changed pid then alert

# Syncthing
check process syncthing with pidfile /usr/local/bastille/jails/syncthing/root/var/run/syncthing.pid
    start program = "/usr/local/bin/bastille start syncthing"
    stop program  = "/usr/local/bin/bastille stop syncthing"
    if changed pid then alert

# Backups
check directory backup-host1 path /data/zfs/backups/host1
   if timestamp > 24 hour then alert
check directory backup-host2 path /data/zfs/backups/host2
   if timestamp > 24 hour then alert

# Snapshots
check directory zfs-snapshots-slash path /.zfs/snapshot
    if timestamp > 2 hours then alert

# Sigal
check file sigal-check path /tmp/sigal-check
    if changed md5 checksum then alert

# Jekyll
check directory jekyll path /data/zfs/www/blog
   if changed timestamp then alert
zpool_usage.sh
#!/bin/sh

echo "cap: $(zpool list -o cap -H $1) used: $(zpool list -o alloc -H $1) free: $(zpool list -o free -H $1) size: $(zpool list -o size -H $1)"
cap="$(zpool list -o cap -H $1 | tr -d '%')"
if [ "$cap" -gt 90 ]
then
    exit 1
fi
zpool_scrub.sh
#!/bin/sh

scrub_expire="3110400" # 36days * 24hours * 60minutes * 60seconds
current_date="$(/bin/date +%s)"
scrub="$(/sbin/zpool status $1 | grep scrub | awk '{print $15 $12 $13}')"
scrub_date="$(date -j -f '%Y%b%e-%H%M%S' $scrub'-000000' +%s)"

echo "$(/sbin/zpool status $1 | grep scrub)"

if [ $(($current_date - $scrub_date)) -ge $scrub_expire ]
then
    exit 1
fi
Then run monit, and check http://localhost:8080. You will now receive a mail when a test fails !
Web server monitoring
Next step is to monitor my web server. Netdata provides a way to get real-time stats from /nginx_status.
If you don’t use Netdata, monitorix could be a good alternative.
Both of those are realtime, I prefer a solution with historization, which would parse access.log to produce some graphs.
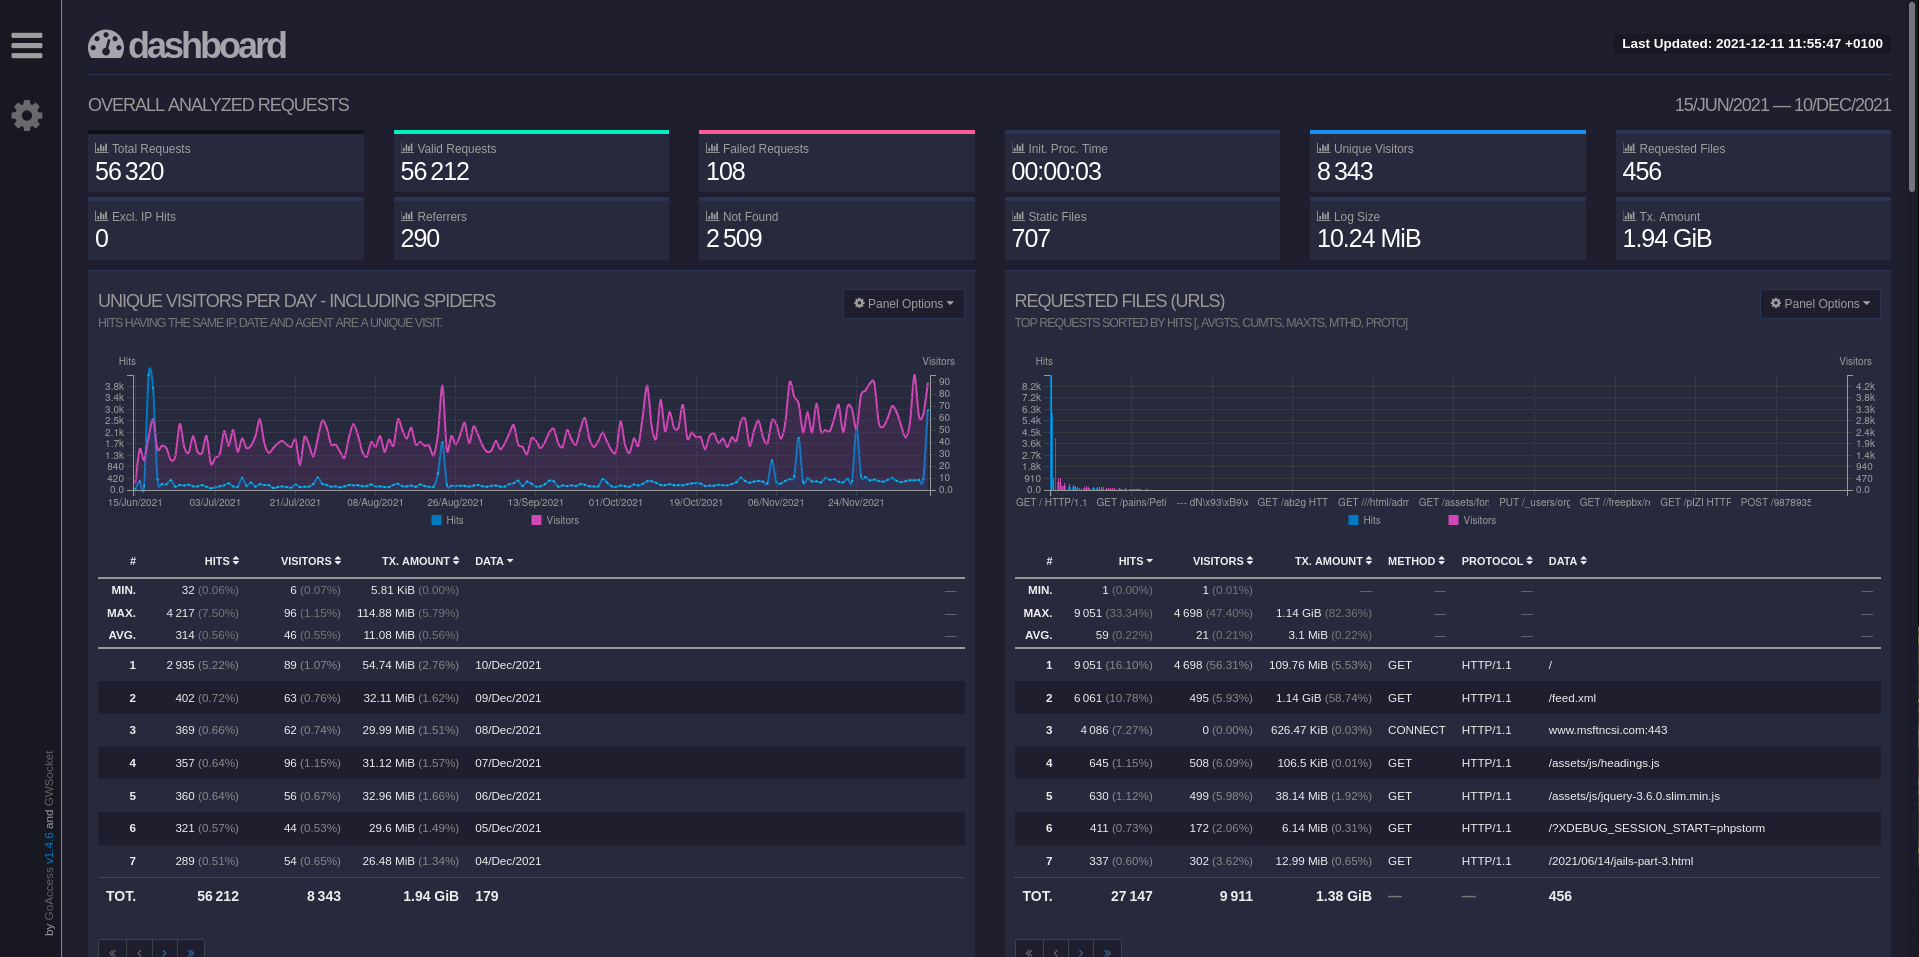
GoAccess can parse logs and do it realtime though its own websocket server, developed by the same guy. The tool is impressive, it can be used cli or generate a html report !
To be able to consult the html report, I choose to generate it statically everyday with a cron and spread it with Syncthing.
- name: generate reports everyday at midnight
  cron:
    name: goaccess report
    job: '/usr/local/bin/goaccess /usr/local/bastille/jails/nginx/root/var/log/nginx/access.log --log-format=COMBINED -o /data/zfs/sync/docs/reports/nginx-goaccess.html'
    hour: '0'
    minute: '0'
    user: root
From any client which has the file synced.
$ firefox ~/share/docs/reports/nginx-goaccess.html
The site is responsive, I can also consult it with my smartphone.
To finish, let’s add a monit service to check that the report is well generated everyday.
# GoAccess
check file goaccess path /data/zfs/sync/docs/reports/nginx-goaccess.html
    if timestamp > 24 hours then alert
The loop is closed.